For quantitative synthesis, EviSyn provides built-in meta-analysis with forest plot generation, data extraction from papers, and risk of bias integration.

Creating a Meta-Analysis

Navigate to Meta-Analysis from your project dashboard and click New Analysis.

Step 1: Topics & Groups

Meta-analysis setup wizard Configure your analysis:
FieldDescription
Analysis TopicWhat you’re comparing (e.g., “ICU Stay after lung cancer surgery”)
DescriptionOptional details about the analysis
Group 1Intervention group label (e.g., “Favours Prehabilitation”)
Group 2Control group label (e.g., “Favours Standard of Care”)
Outcome TypeContinuous or Binary
Effect MeasureSMD, MD, OR, RR, etc.
ModelFixed Effect or Random Effects
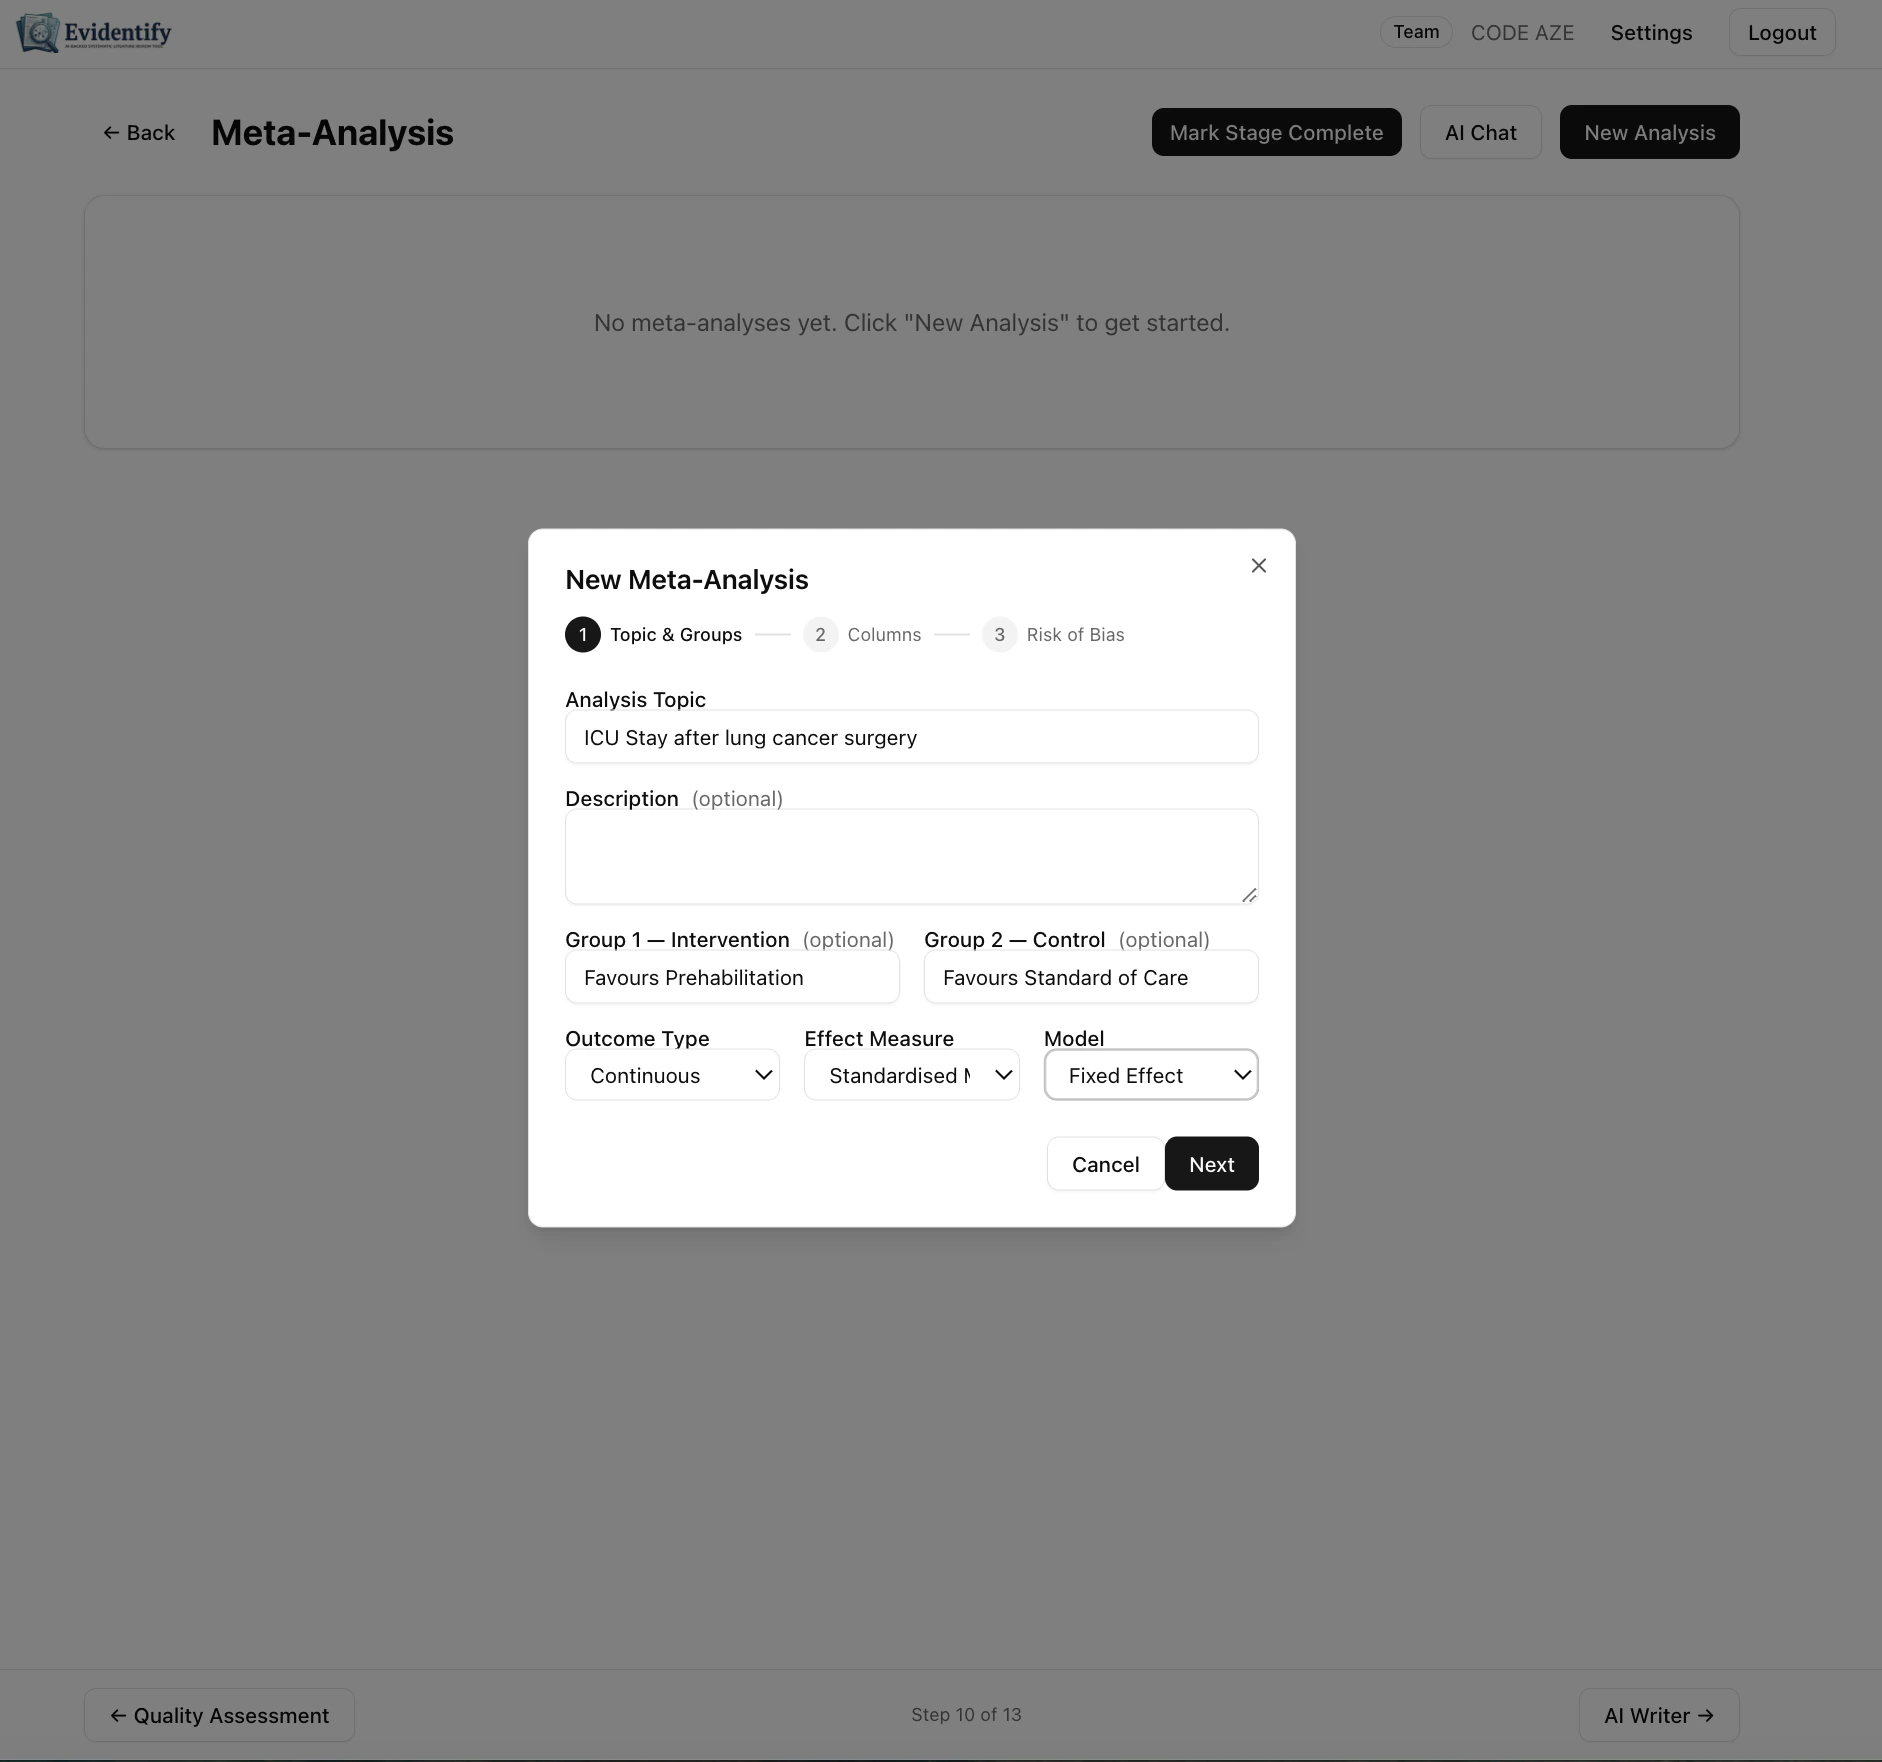
Click Next to proceed.

Step 2: Columns

Column configuration Columns are auto-populated based on your outcome type and effect measure:
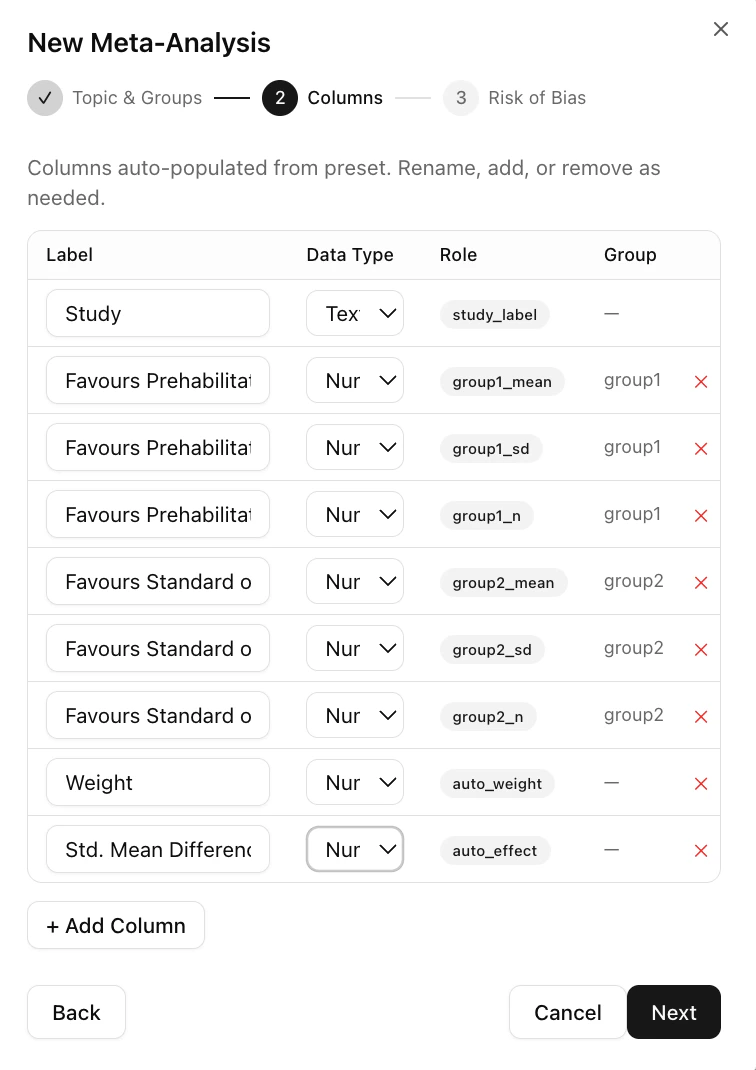
  • Study — Study identifier
  • Group 1 Mean/SD/Total — Intervention group statistics
  • Group 2 Mean/SD/Total — Control group statistics
  • Weight — Study weight in the analysis
  • Std. Mean Difference — Calculated effect size
You can rename, add, or remove columns as needed.

Step 3: Risk of Bias

Risk of bias template selection Select a risk of bias template to integrate with your analysis:
TemplateDescription
RoB 2.0 (Cochrane)Standard 5-domain RoB2 assessment
ROBINS-I (Non-randomized)For non-randomized studies
Newcastle-Ottawa ScaleFor observational studies
Custom (start empty)Build your own domains
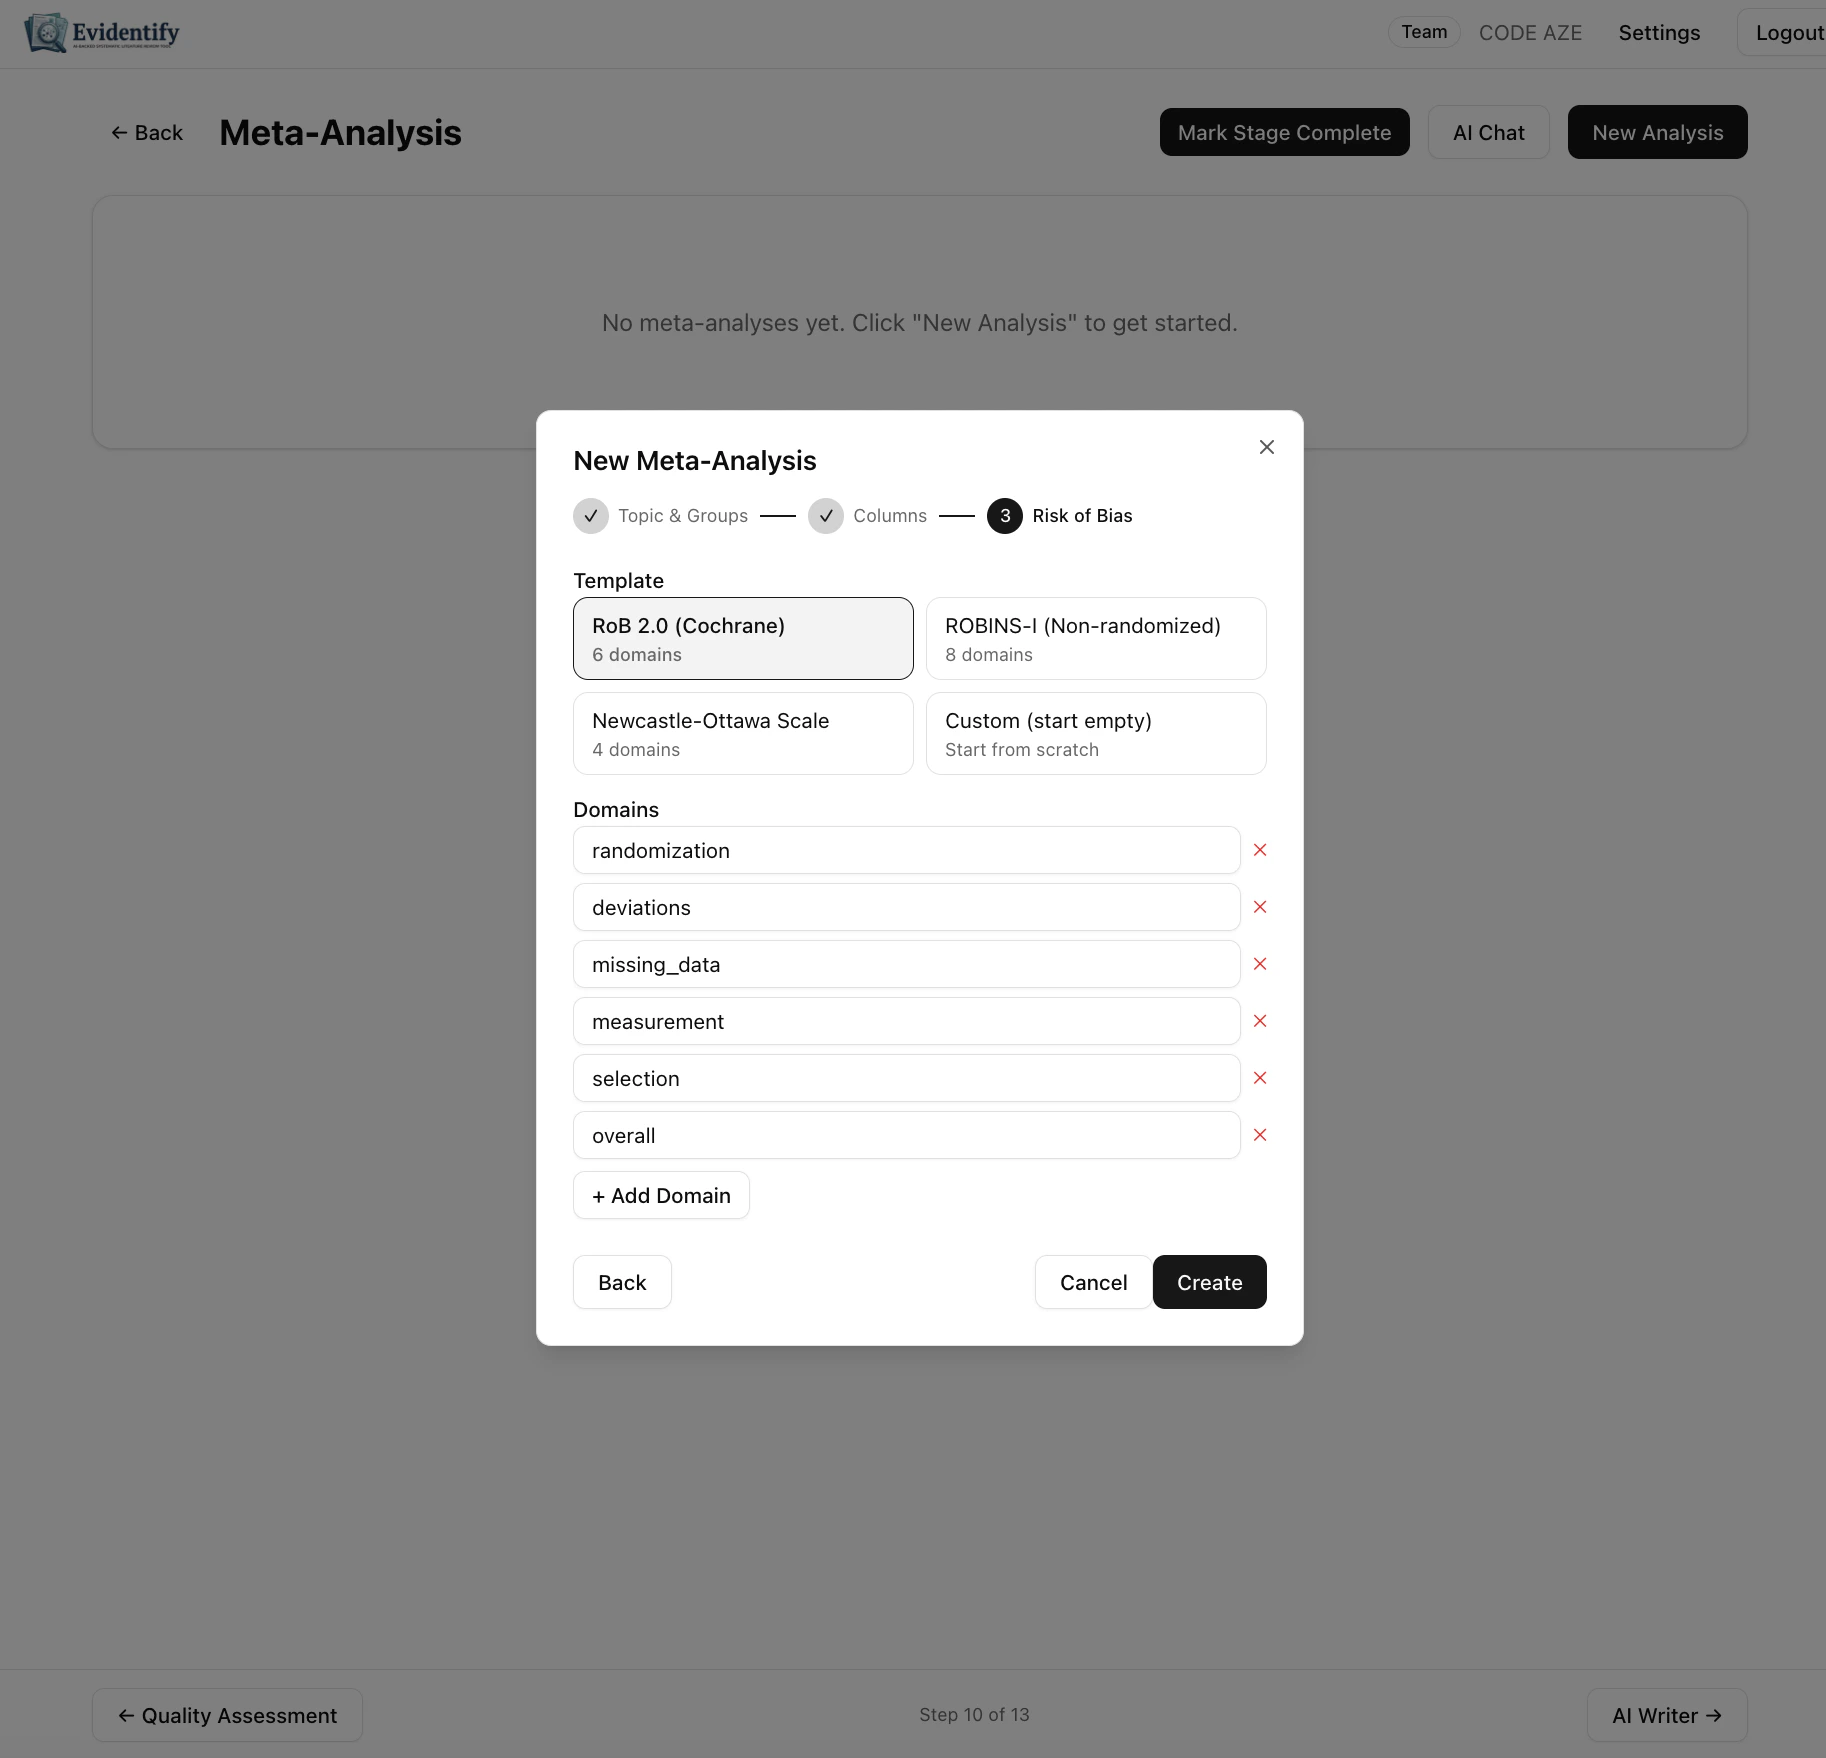
Domains are displayed as columns in your analysis table.

The Analysis Table

Meta-analysis data table The analysis table shows:
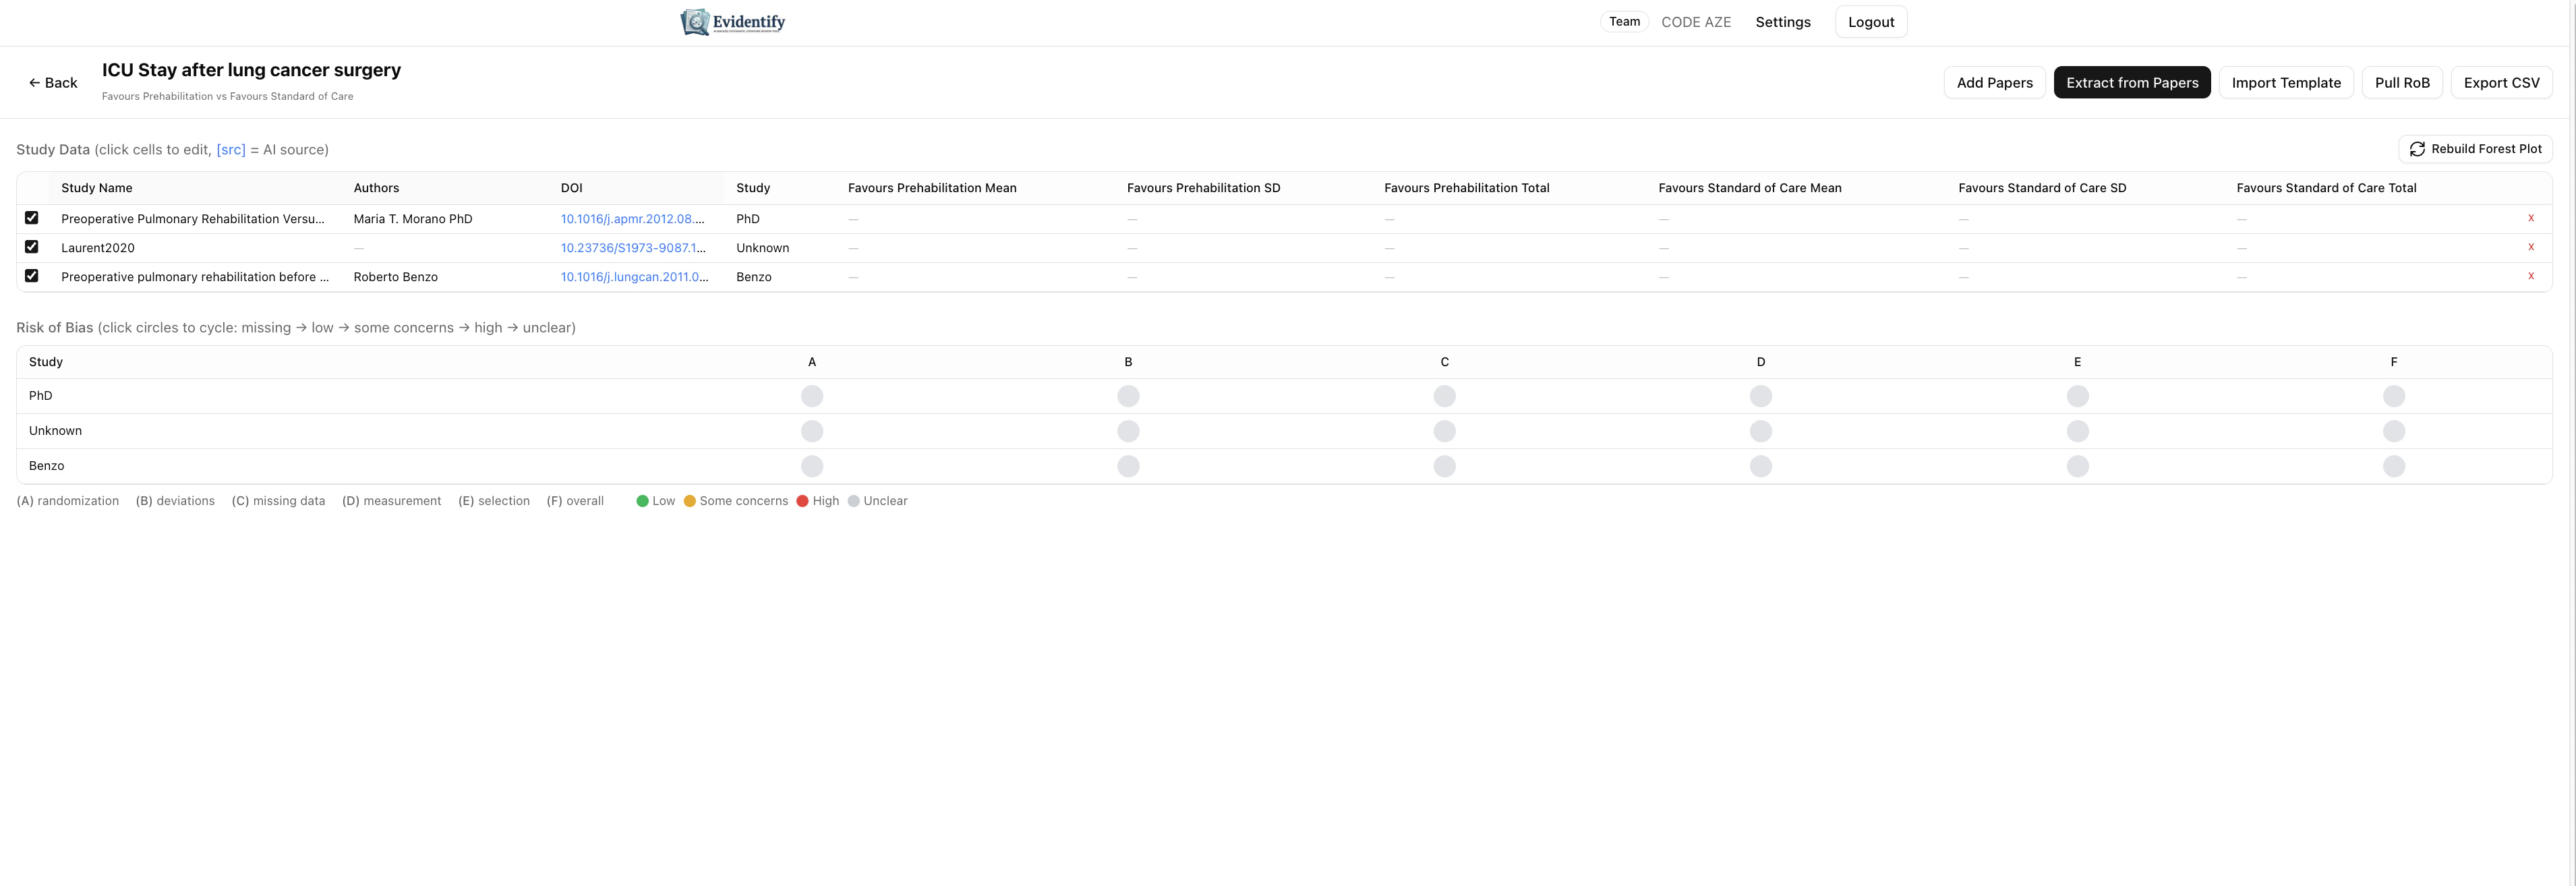
  • Study data — Click cells to edit values directly
  • Effect sizes — Auto-calculated based on your input
  • Risk of bias — Color-coded traffic light indicators per domain

Adding Studies

MethodHow
Add PapersSelect from your finalized papers
Extract from PapersAI reads papers and populates data automatically
Import TemplateImport from a pre-filled spreadsheet
Manual EntryClick cells to enter data directly

AI Data Extraction

Click Extract from Papers to have the AI read each paper and populate the meta-analysis columns:
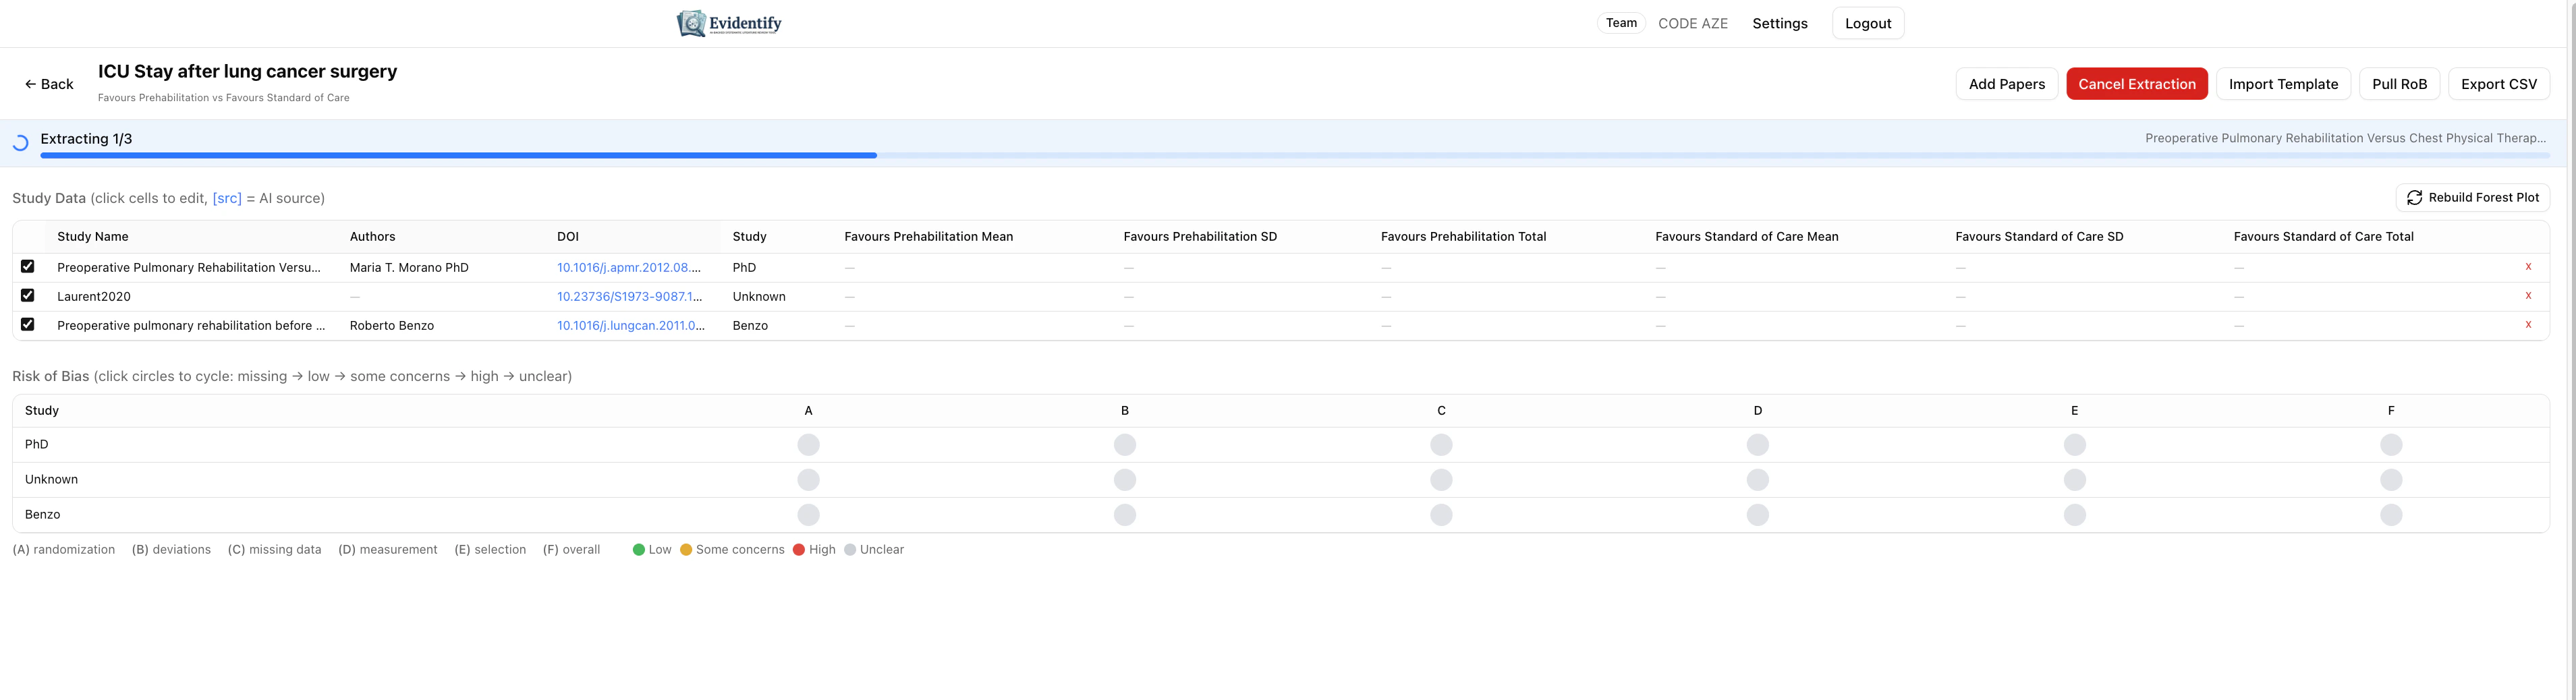
 AI extracting data into meta-analysis The extraction progress bar shows which paper is being processed.

Forest Plot

Click Rebuild Forest Plot to generate a publication-ready visualization. Forest plot with risk of bias The forest plot shows:
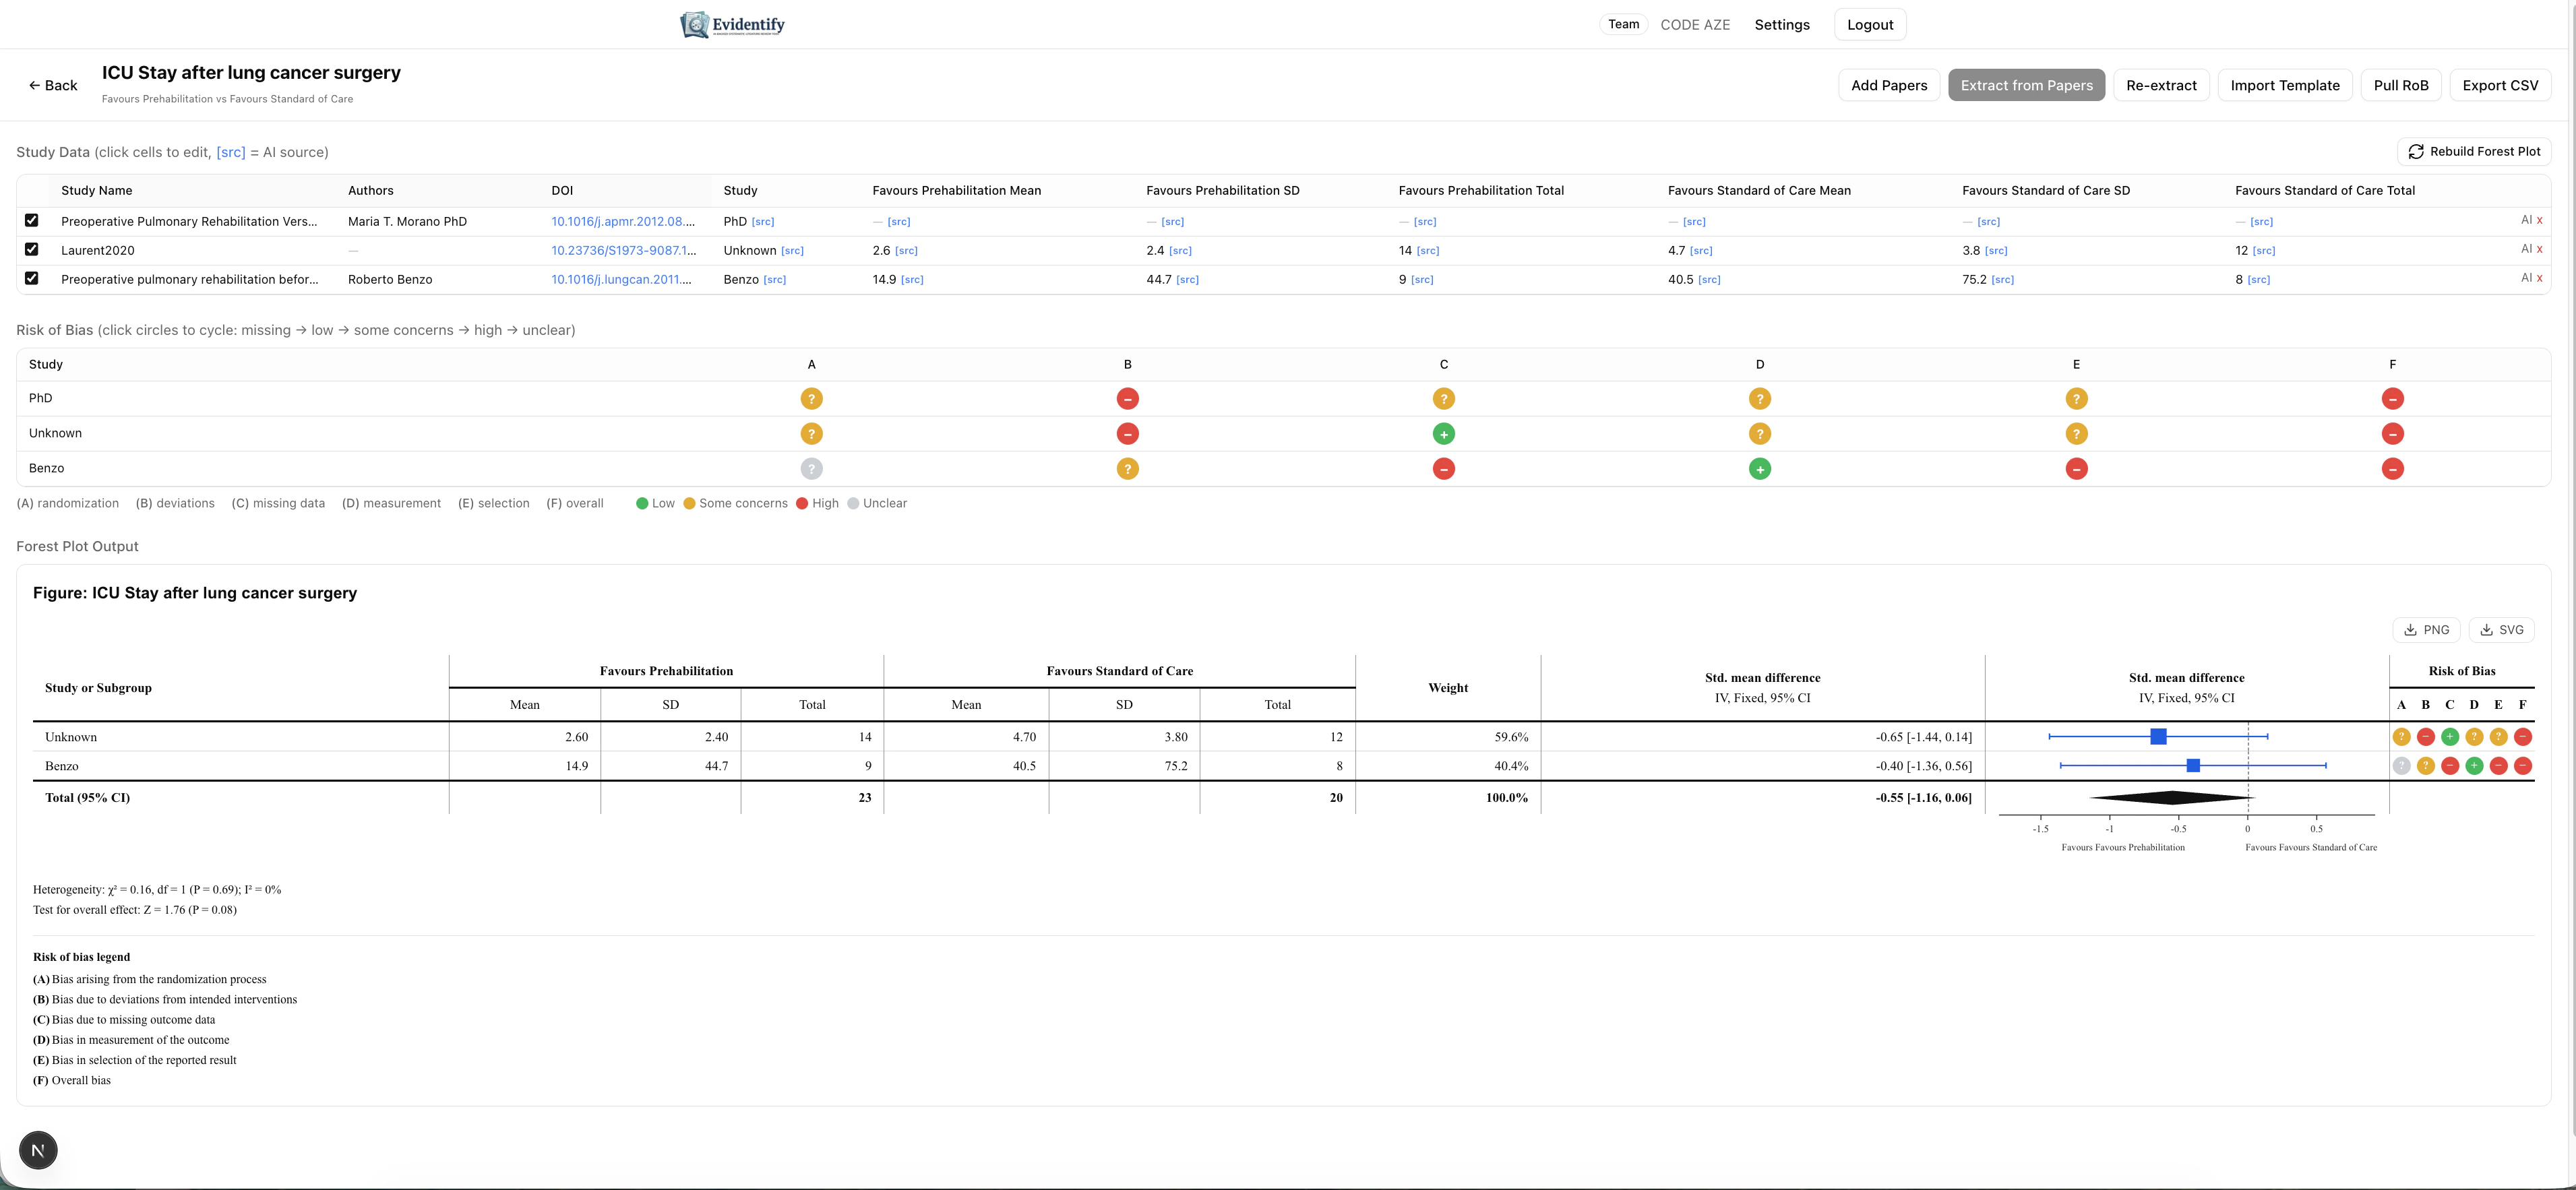
  • Effect sizes with confidence intervals for each study
  • Diamond for the pooled effect
  • Heterogeneity statistics (I², Q, p-value)
  • Risk of bias traffic lights — colored circles showing RoB2 domain ratings per study
  • Overall risk of bias column

Export Options

FormatDescription
Pull RoBSync risk of bias data from quality assessment
Import TemplateImport study data from spreadsheet
Export CSVDownload the full analysis table

What’s Next?

After meta-analysis, proceed to Manuscript Writer to draft your Results and Discussion sections.