> ## Documentation Index
> Fetch the complete documentation index at: https://docs-evisyn.grabmywork.com/llms.txt
> Use this file to discover all available pages before exploring further.
# Meta-Analysis
> Forest plots, effect sizes, and risk of bias visualization
For quantitative synthesis, EviSyn provides built-in meta-analysis with forest plot generation, data extraction from papers, and risk of bias integration.
## Creating a Meta-Analysis
Navigate to **Meta-Analysis** from your project dashboard and click **New Analysis**.
### Step 1: Topics & Groups
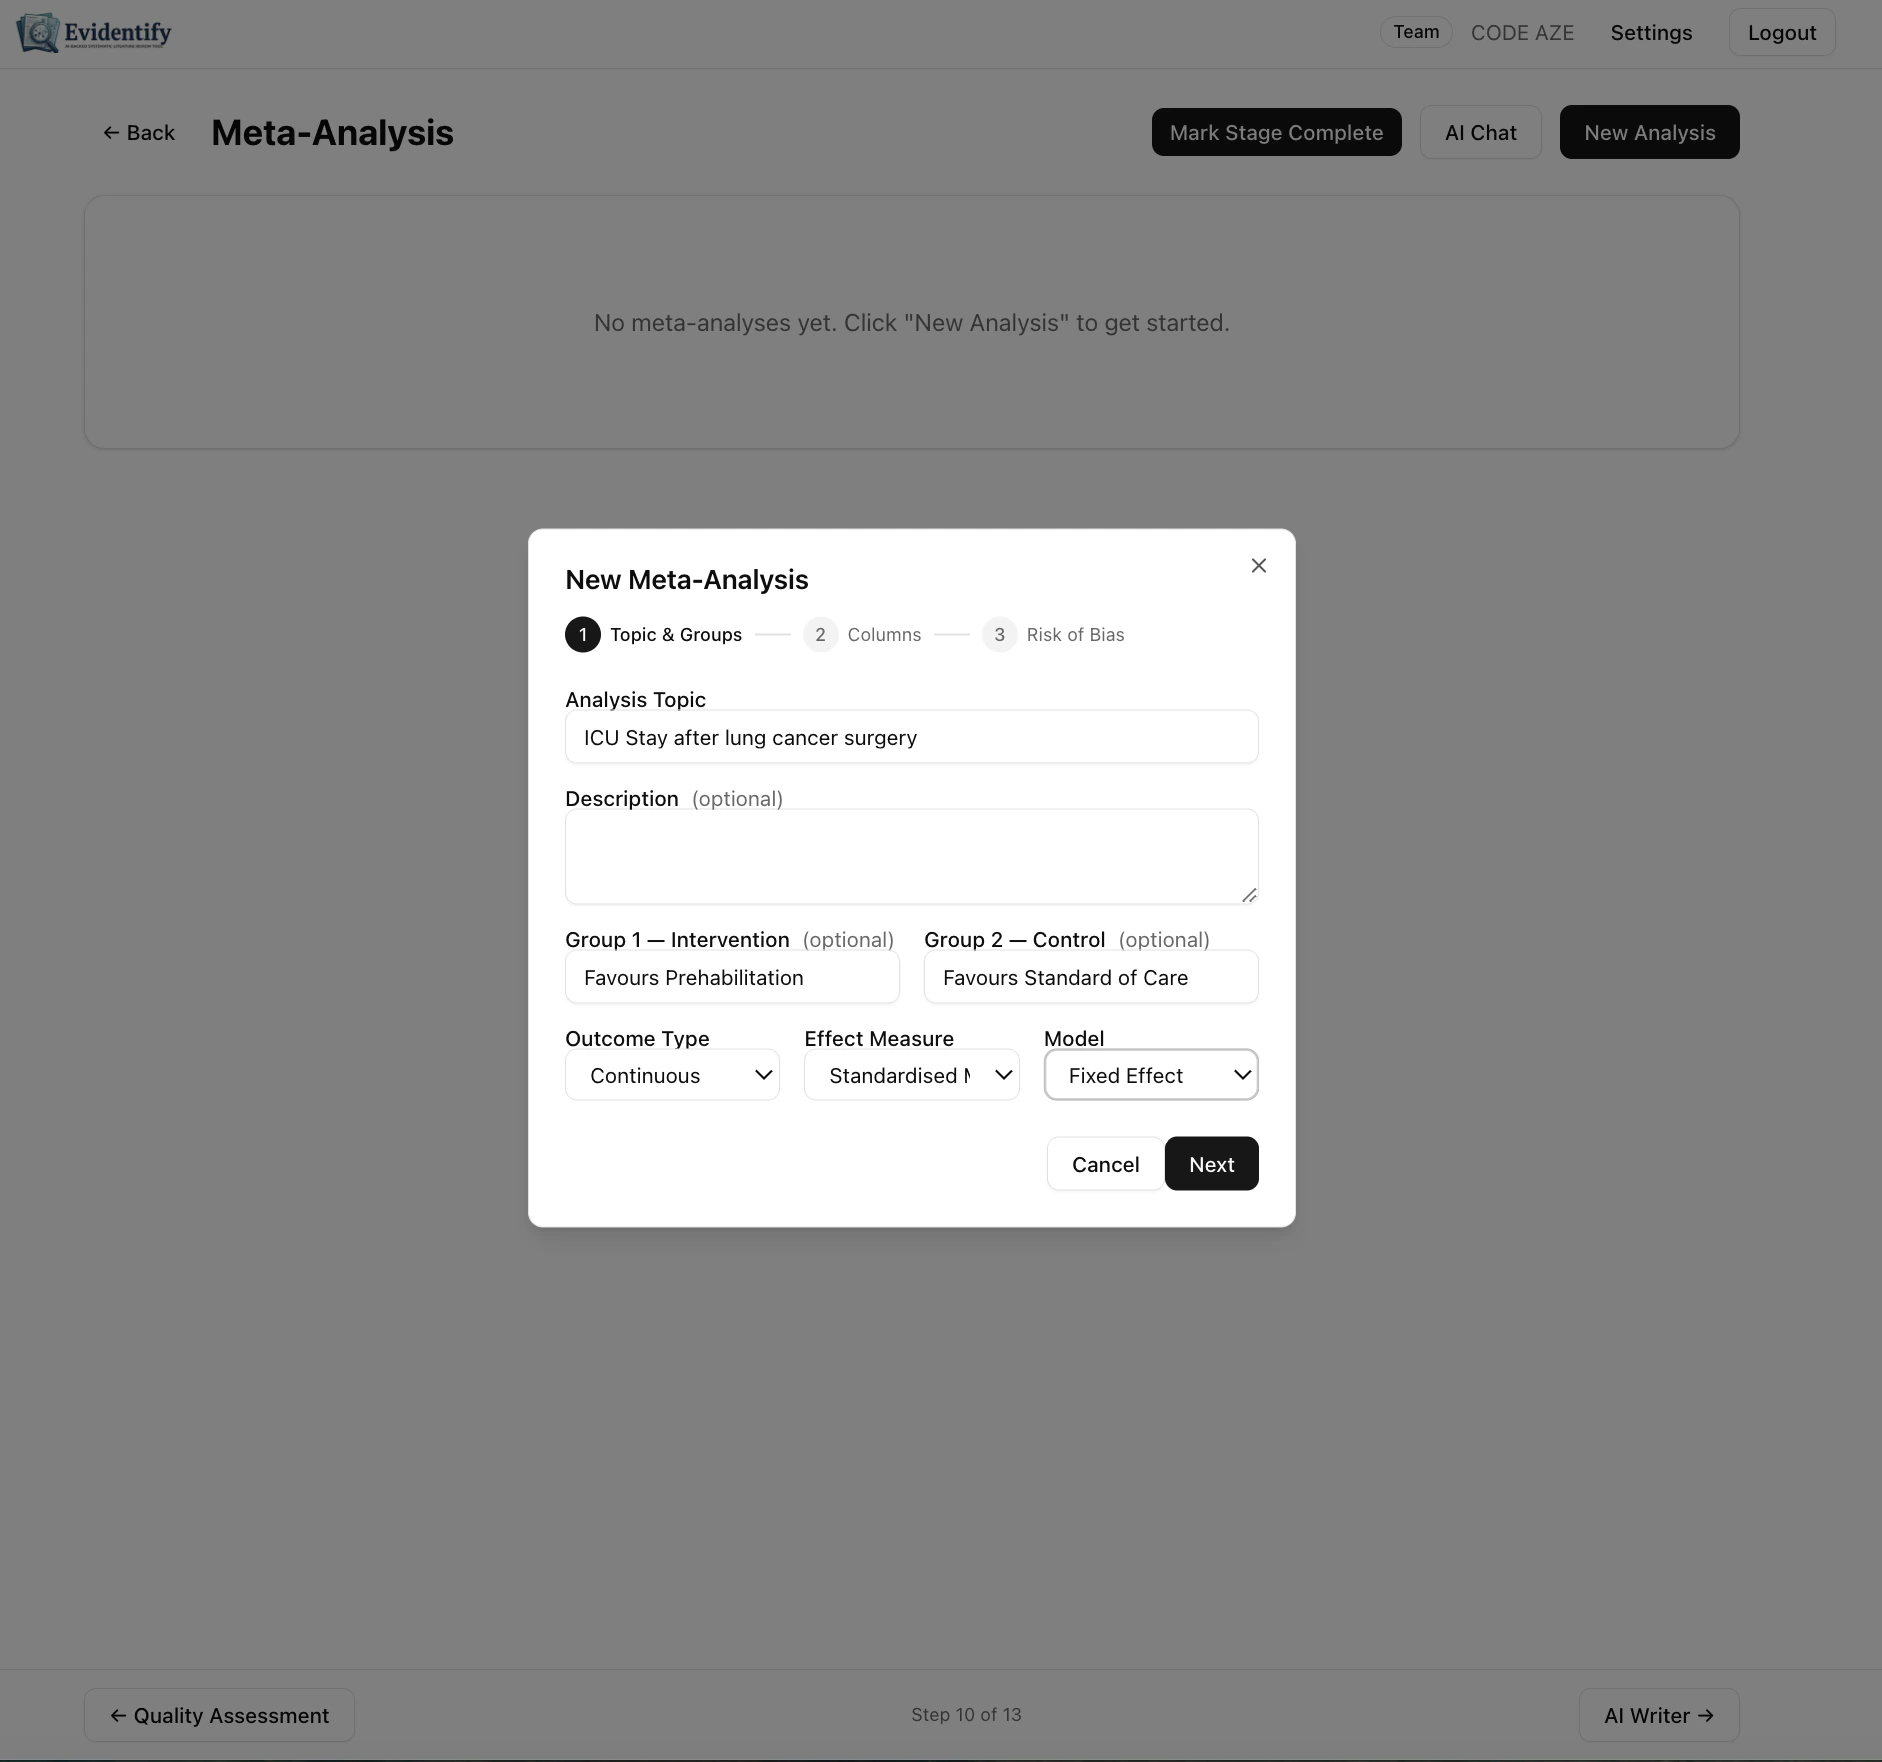 Configure your analysis:
| Field | Description |
| ------------------ | ------------------------------------------------------------------ |
| **Analysis Topic** | What you're comparing (e.g., "ICU Stay after lung cancer surgery") |
| **Description** | Optional details about the analysis |
| **Group 1** | Intervention group label (e.g., "Favours Prehabilitation") |
| **Group 2** | Control group label (e.g., "Favours Standard of Care") |
| **Outcome Type** | Continuous or Binary |
| **Effect Measure** | SMD, MD, OR, RR, etc. |
| **Model** | Fixed Effect or Random Effects |
Click **Next** to proceed.
### Step 2: Columns
Configure your analysis:
| Field | Description |
| ------------------ | ------------------------------------------------------------------ |
| **Analysis Topic** | What you're comparing (e.g., "ICU Stay after lung cancer surgery") |
| **Description** | Optional details about the analysis |
| **Group 1** | Intervention group label (e.g., "Favours Prehabilitation") |
| **Group 2** | Control group label (e.g., "Favours Standard of Care") |
| **Outcome Type** | Continuous or Binary |
| **Effect Measure** | SMD, MD, OR, RR, etc. |
| **Model** | Fixed Effect or Random Effects |
Click **Next** to proceed.
### Step 2: Columns
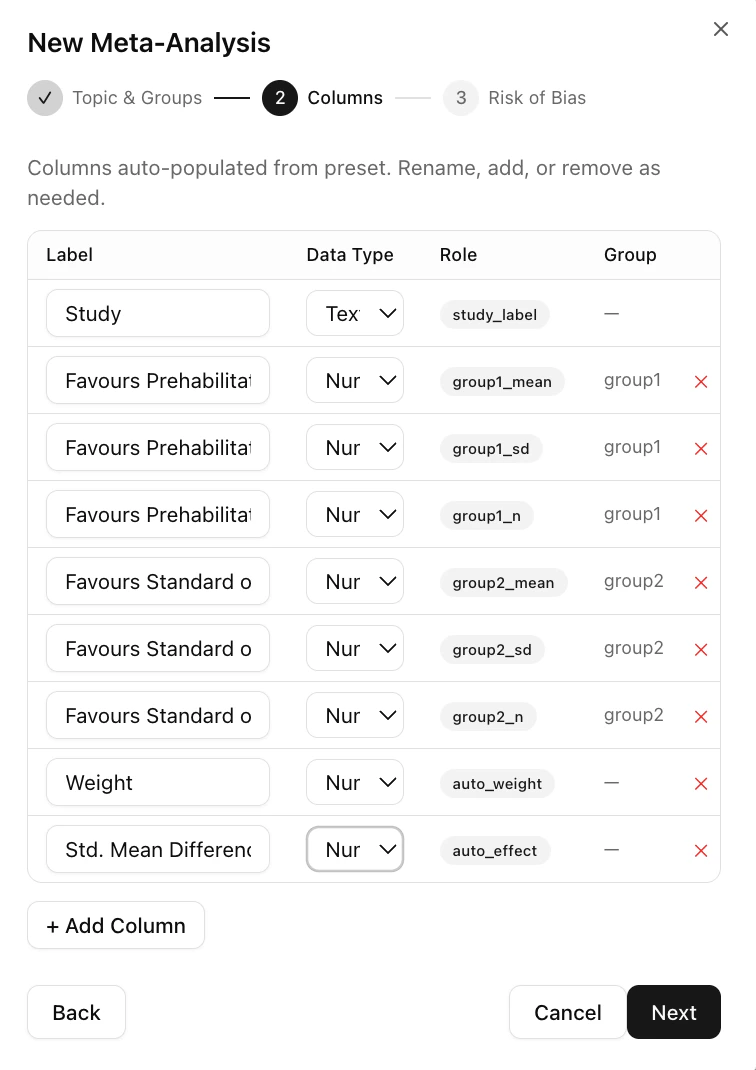 Columns are auto-populated based on your outcome type and effect measure:
* **Study** — Study identifier
* **Group 1 Mean/SD/Total** — Intervention group statistics
* **Group 2 Mean/SD/Total** — Control group statistics
* **Weight** — Study weight in the analysis
* **Std. Mean Difference** — Calculated effect size
You can rename, add, or remove columns as needed.
### Step 3: Risk of Bias
Columns are auto-populated based on your outcome type and effect measure:
* **Study** — Study identifier
* **Group 1 Mean/SD/Total** — Intervention group statistics
* **Group 2 Mean/SD/Total** — Control group statistics
* **Weight** — Study weight in the analysis
* **Std. Mean Difference** — Calculated effect size
You can rename, add, or remove columns as needed.
### Step 3: Risk of Bias
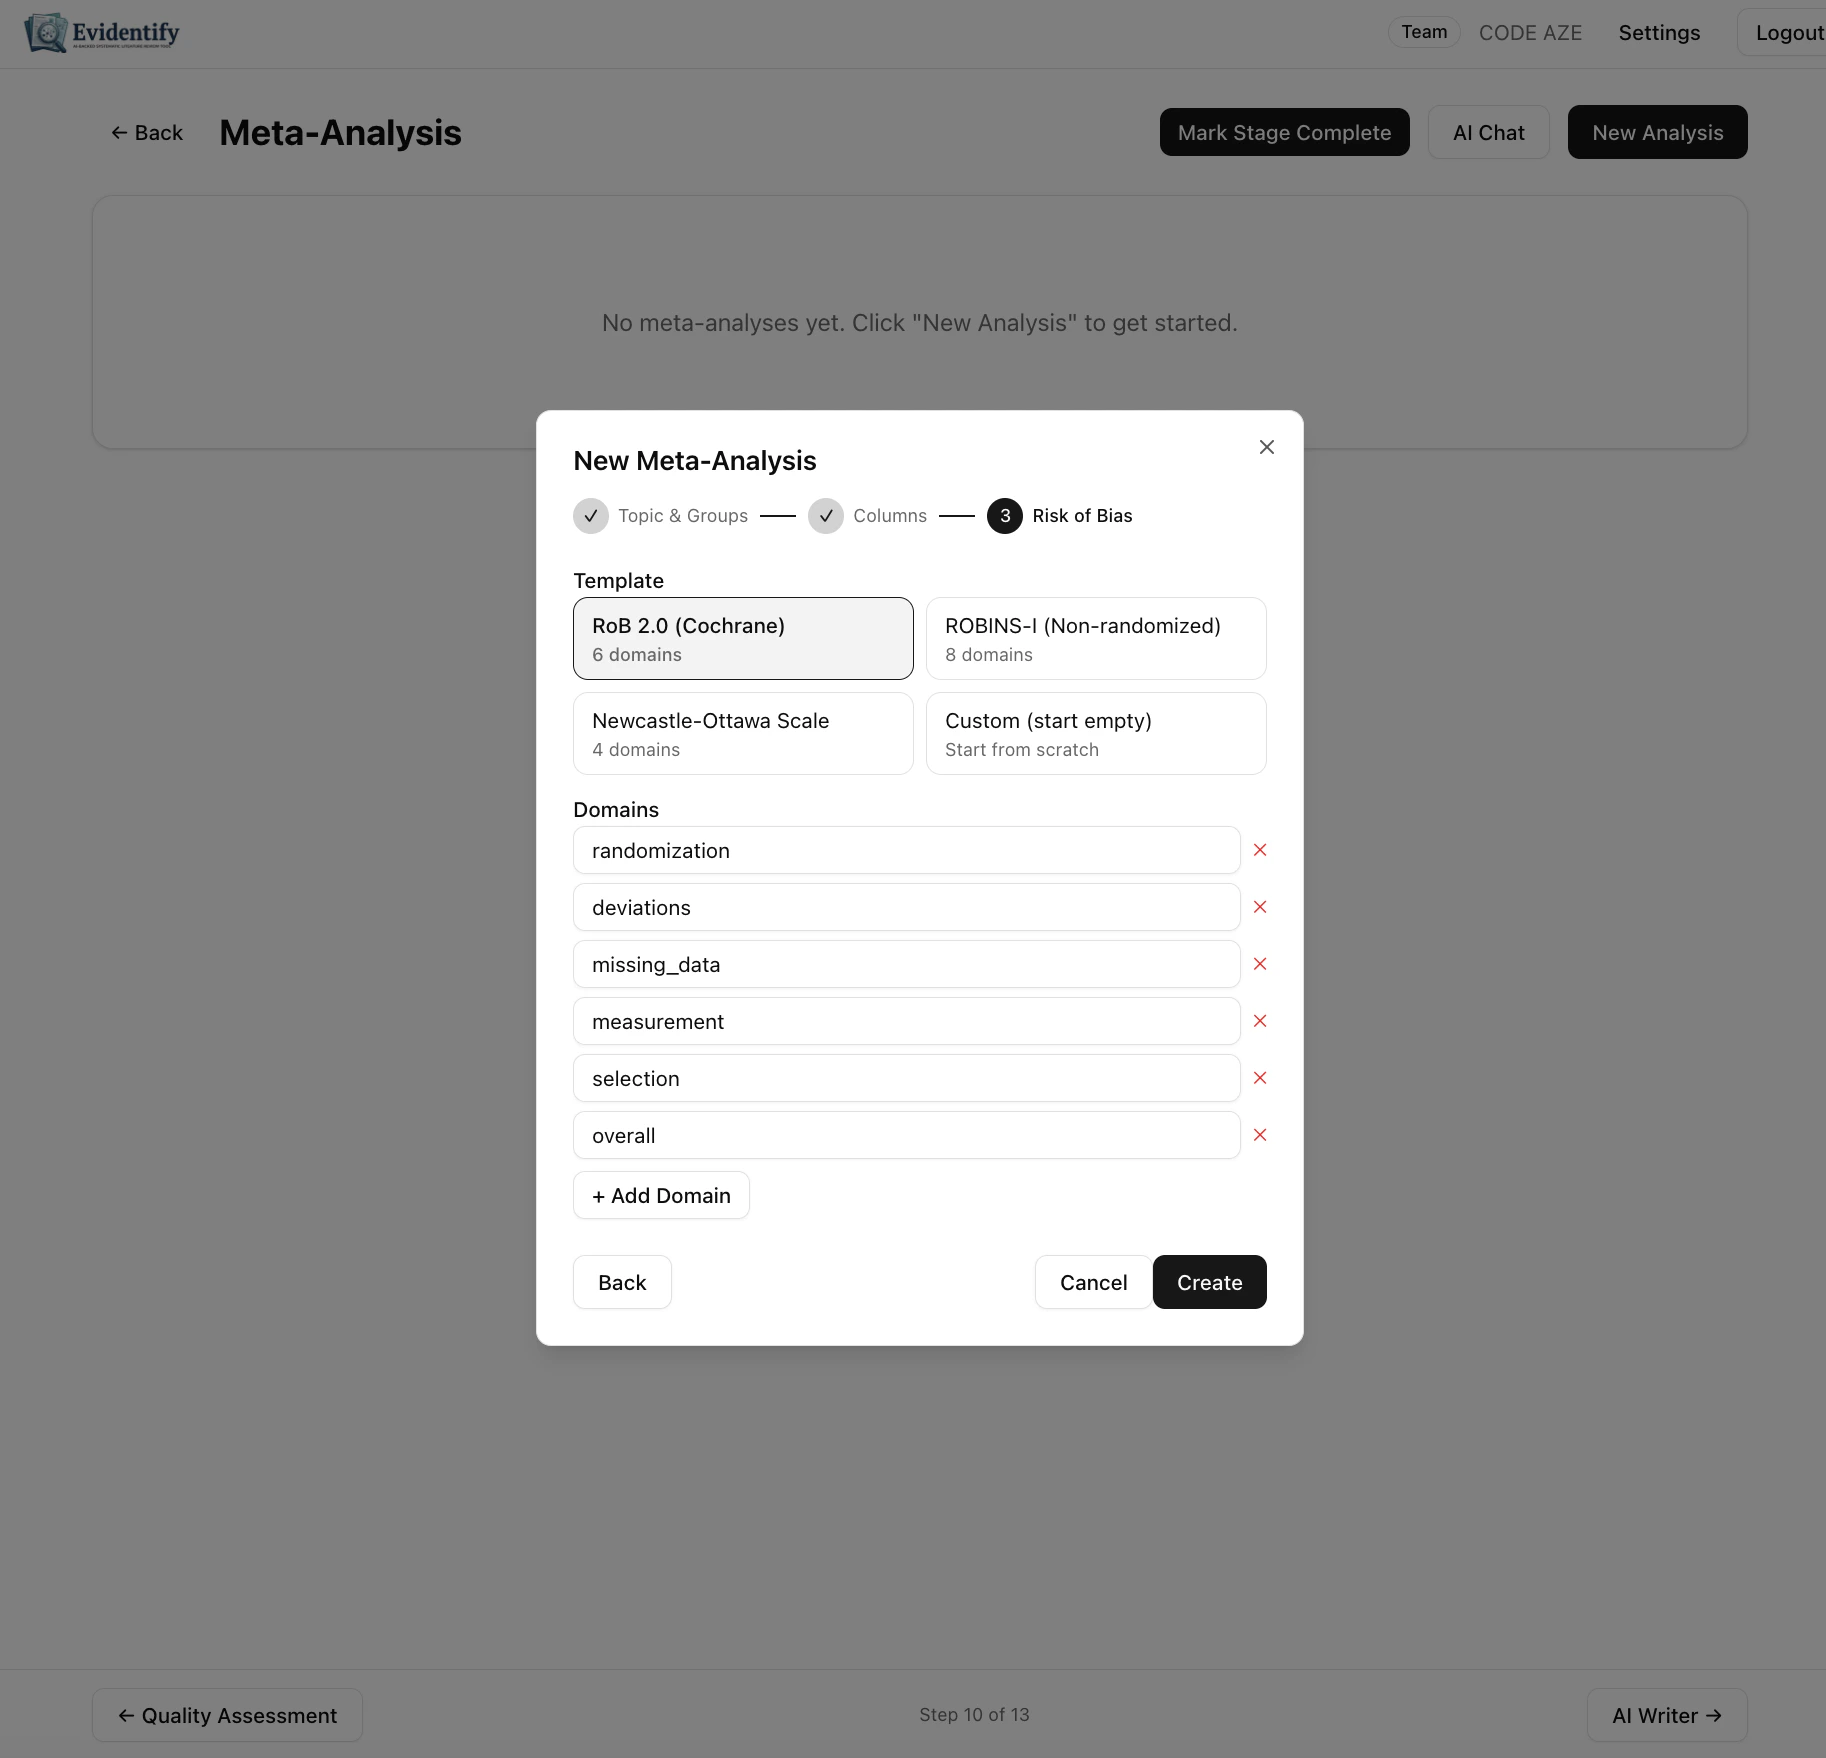 Select a risk of bias template to integrate with your analysis:
| Template | Description |
| ----------------------------- | --------------------------------- |
| **RoB 2.0 (Cochrane)** | Standard 5-domain RoB2 assessment |
| **ROBINS-I (Non-randomized)** | For non-randomized studies |
| **Newcastle-Ottawa Scale** | For observational studies |
| **Custom (start empty)** | Build your own domains |
Domains are displayed as columns in your analysis table.
## The Analysis Table
Select a risk of bias template to integrate with your analysis:
| Template | Description |
| ----------------------------- | --------------------------------- |
| **RoB 2.0 (Cochrane)** | Standard 5-domain RoB2 assessment |
| **ROBINS-I (Non-randomized)** | For non-randomized studies |
| **Newcastle-Ottawa Scale** | For observational studies |
| **Custom (start empty)** | Build your own domains |
Domains are displayed as columns in your analysis table.
## The Analysis Table
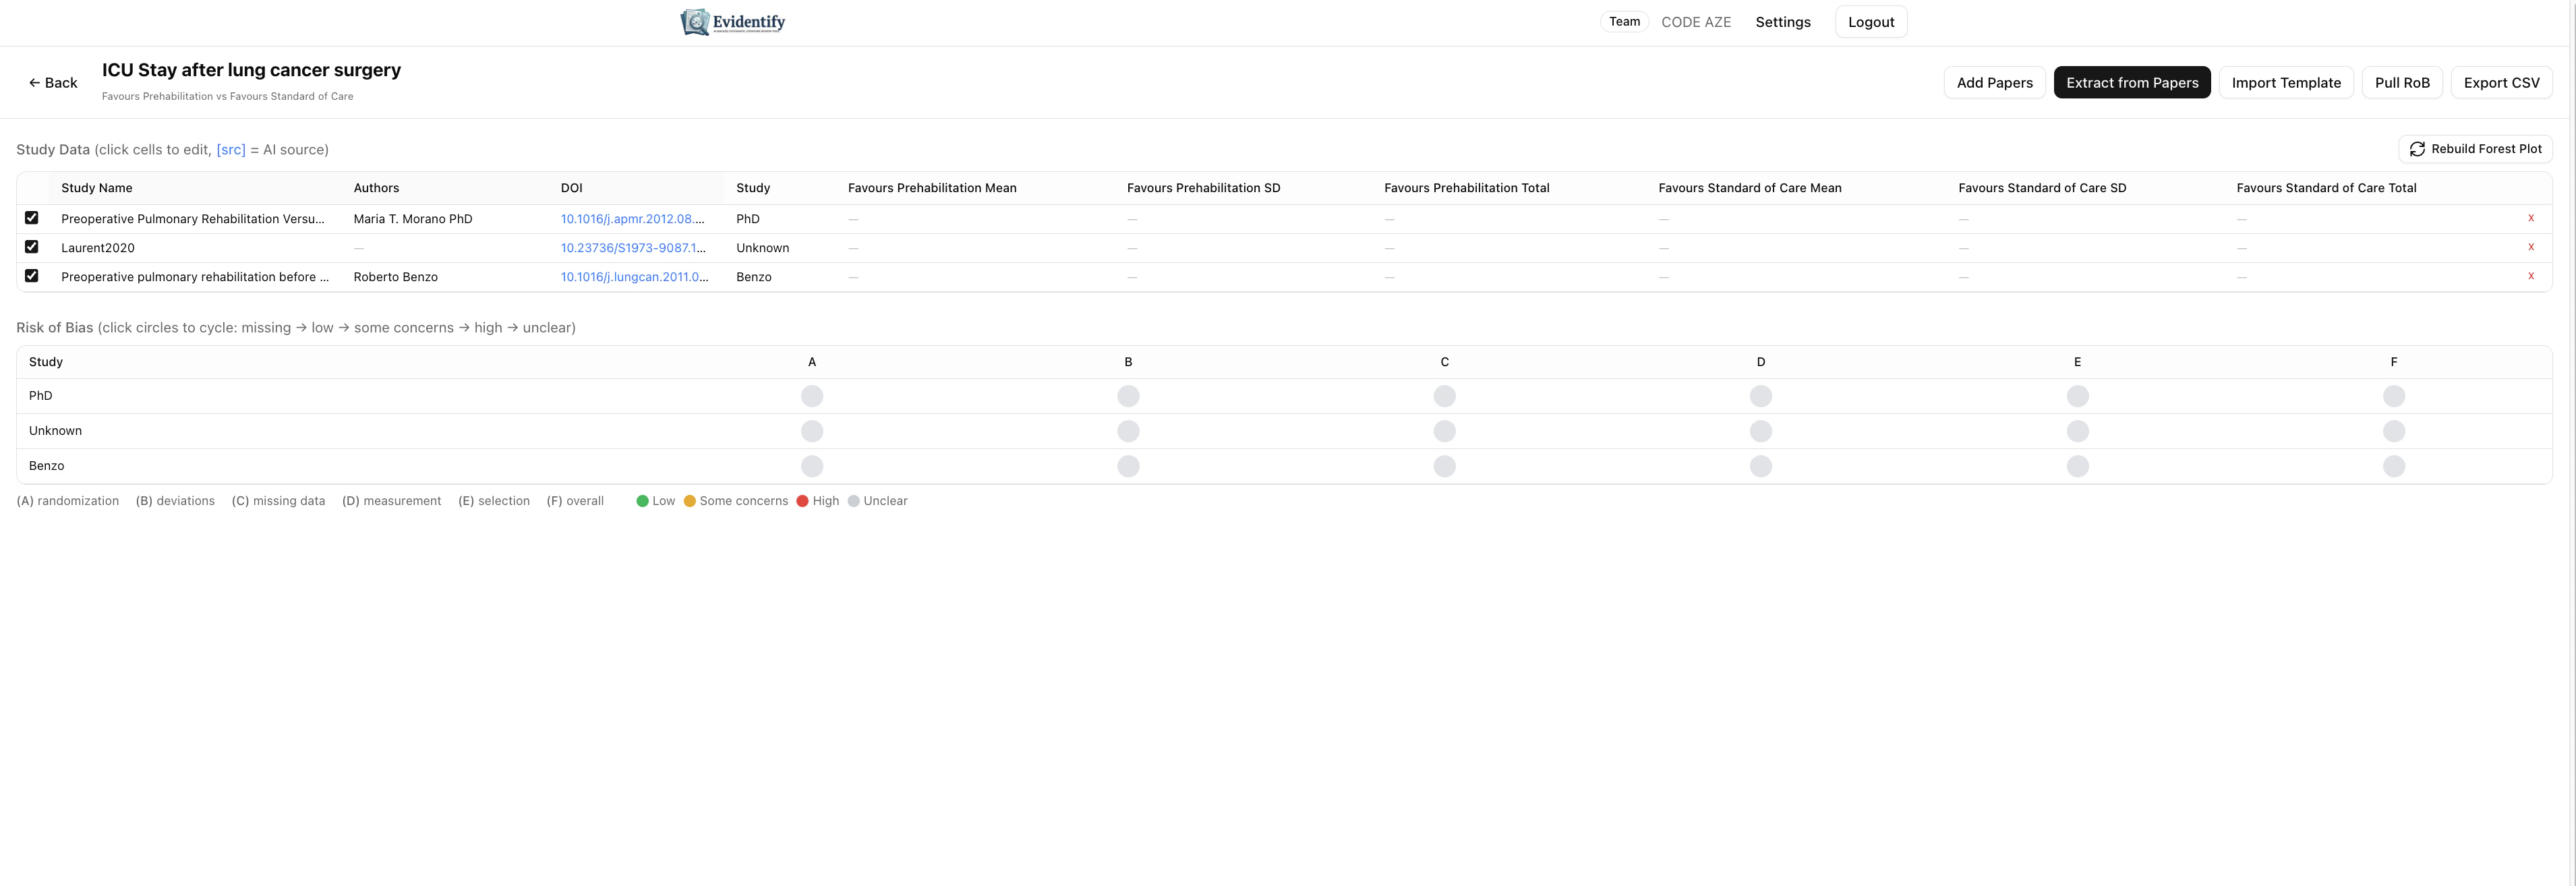 The analysis table shows:
* **Study data** — Click cells to edit values directly
* **Effect sizes** — Auto-calculated based on your input
* **Risk of bias** — Color-coded traffic light indicators per domain
### Adding Studies
| Method | How |
| ----------------------- | ------------------------------------------------ |
| **Add Papers** | Select from your finalized papers |
| **Extract from Papers** | AI reads papers and populates data automatically |
| **Import Template** | Import from a pre-filled spreadsheet |
| **Manual Entry** | Click cells to enter data directly |
### AI Data Extraction
Click **Extract from Papers** to have the AI read each paper and populate the meta-analysis columns:
The analysis table shows:
* **Study data** — Click cells to edit values directly
* **Effect sizes** — Auto-calculated based on your input
* **Risk of bias** — Color-coded traffic light indicators per domain
### Adding Studies
| Method | How |
| ----------------------- | ------------------------------------------------ |
| **Add Papers** | Select from your finalized papers |
| **Extract from Papers** | AI reads papers and populates data automatically |
| **Import Template** | Import from a pre-filled spreadsheet |
| **Manual Entry** | Click cells to enter data directly |
### AI Data Extraction
Click **Extract from Papers** to have the AI read each paper and populate the meta-analysis columns:
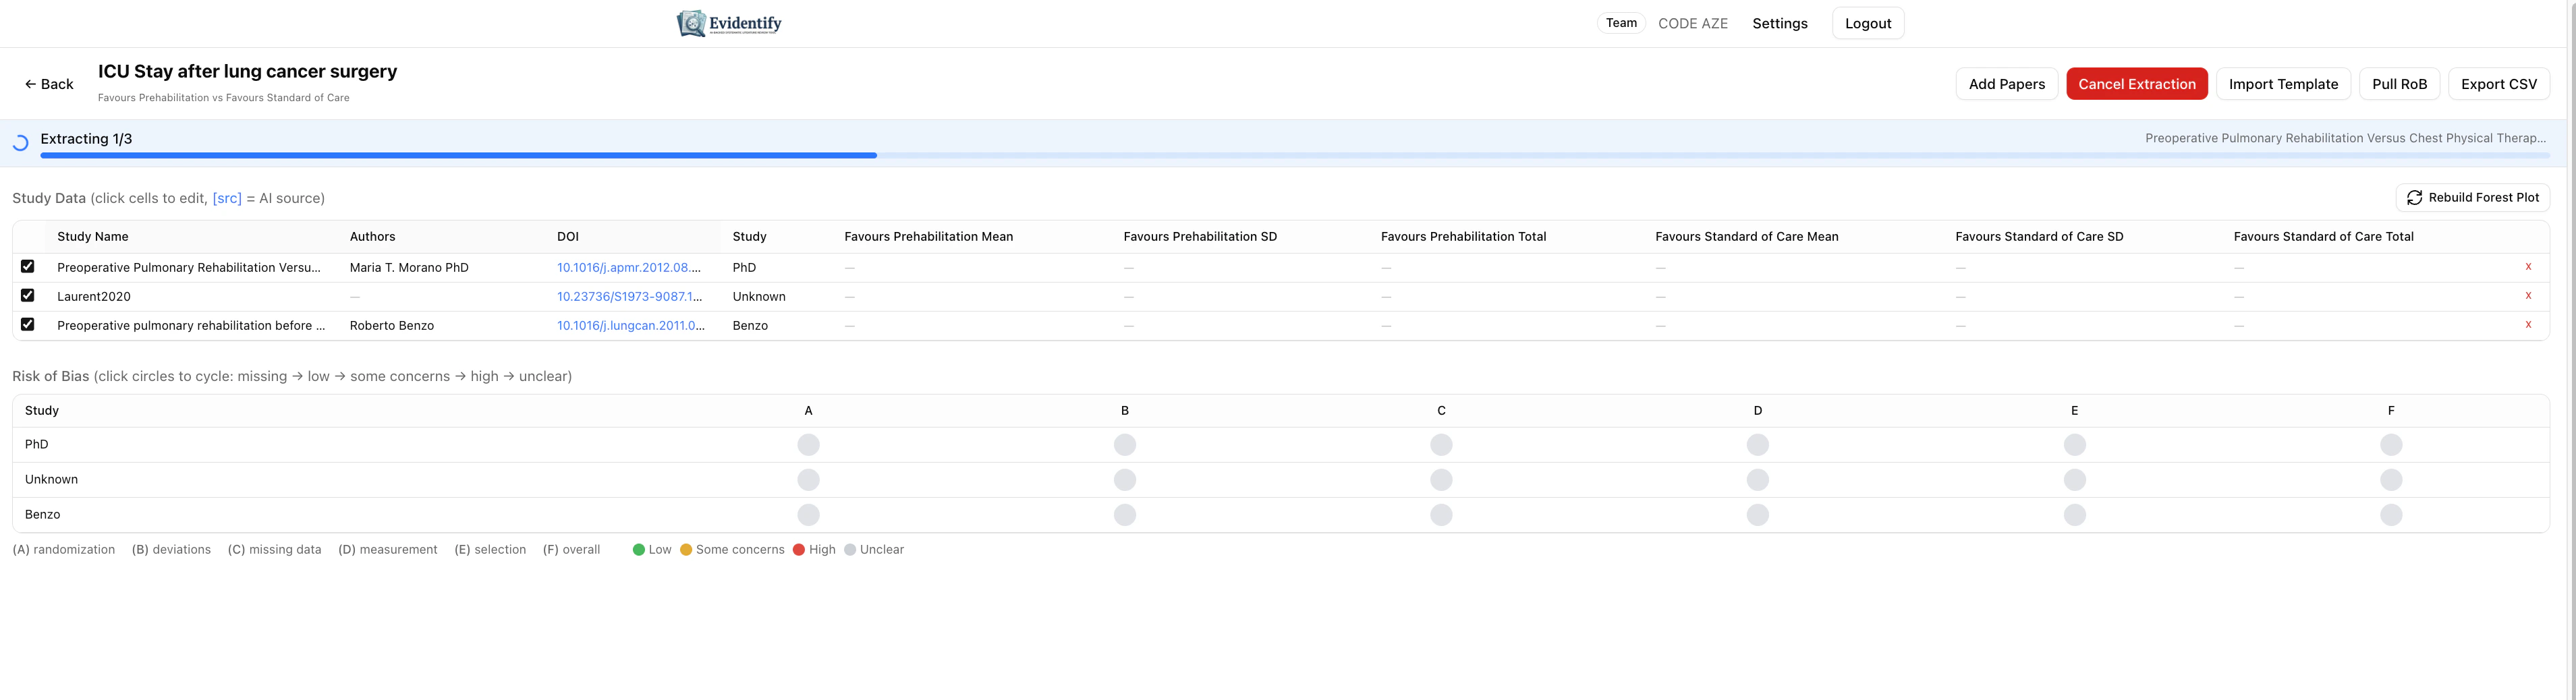 The extraction progress bar shows which paper is being processed.
## Forest Plot
Click **Rebuild Forest Plot** to generate a publication-ready visualization.
The extraction progress bar shows which paper is being processed.
## Forest Plot
Click **Rebuild Forest Plot** to generate a publication-ready visualization.
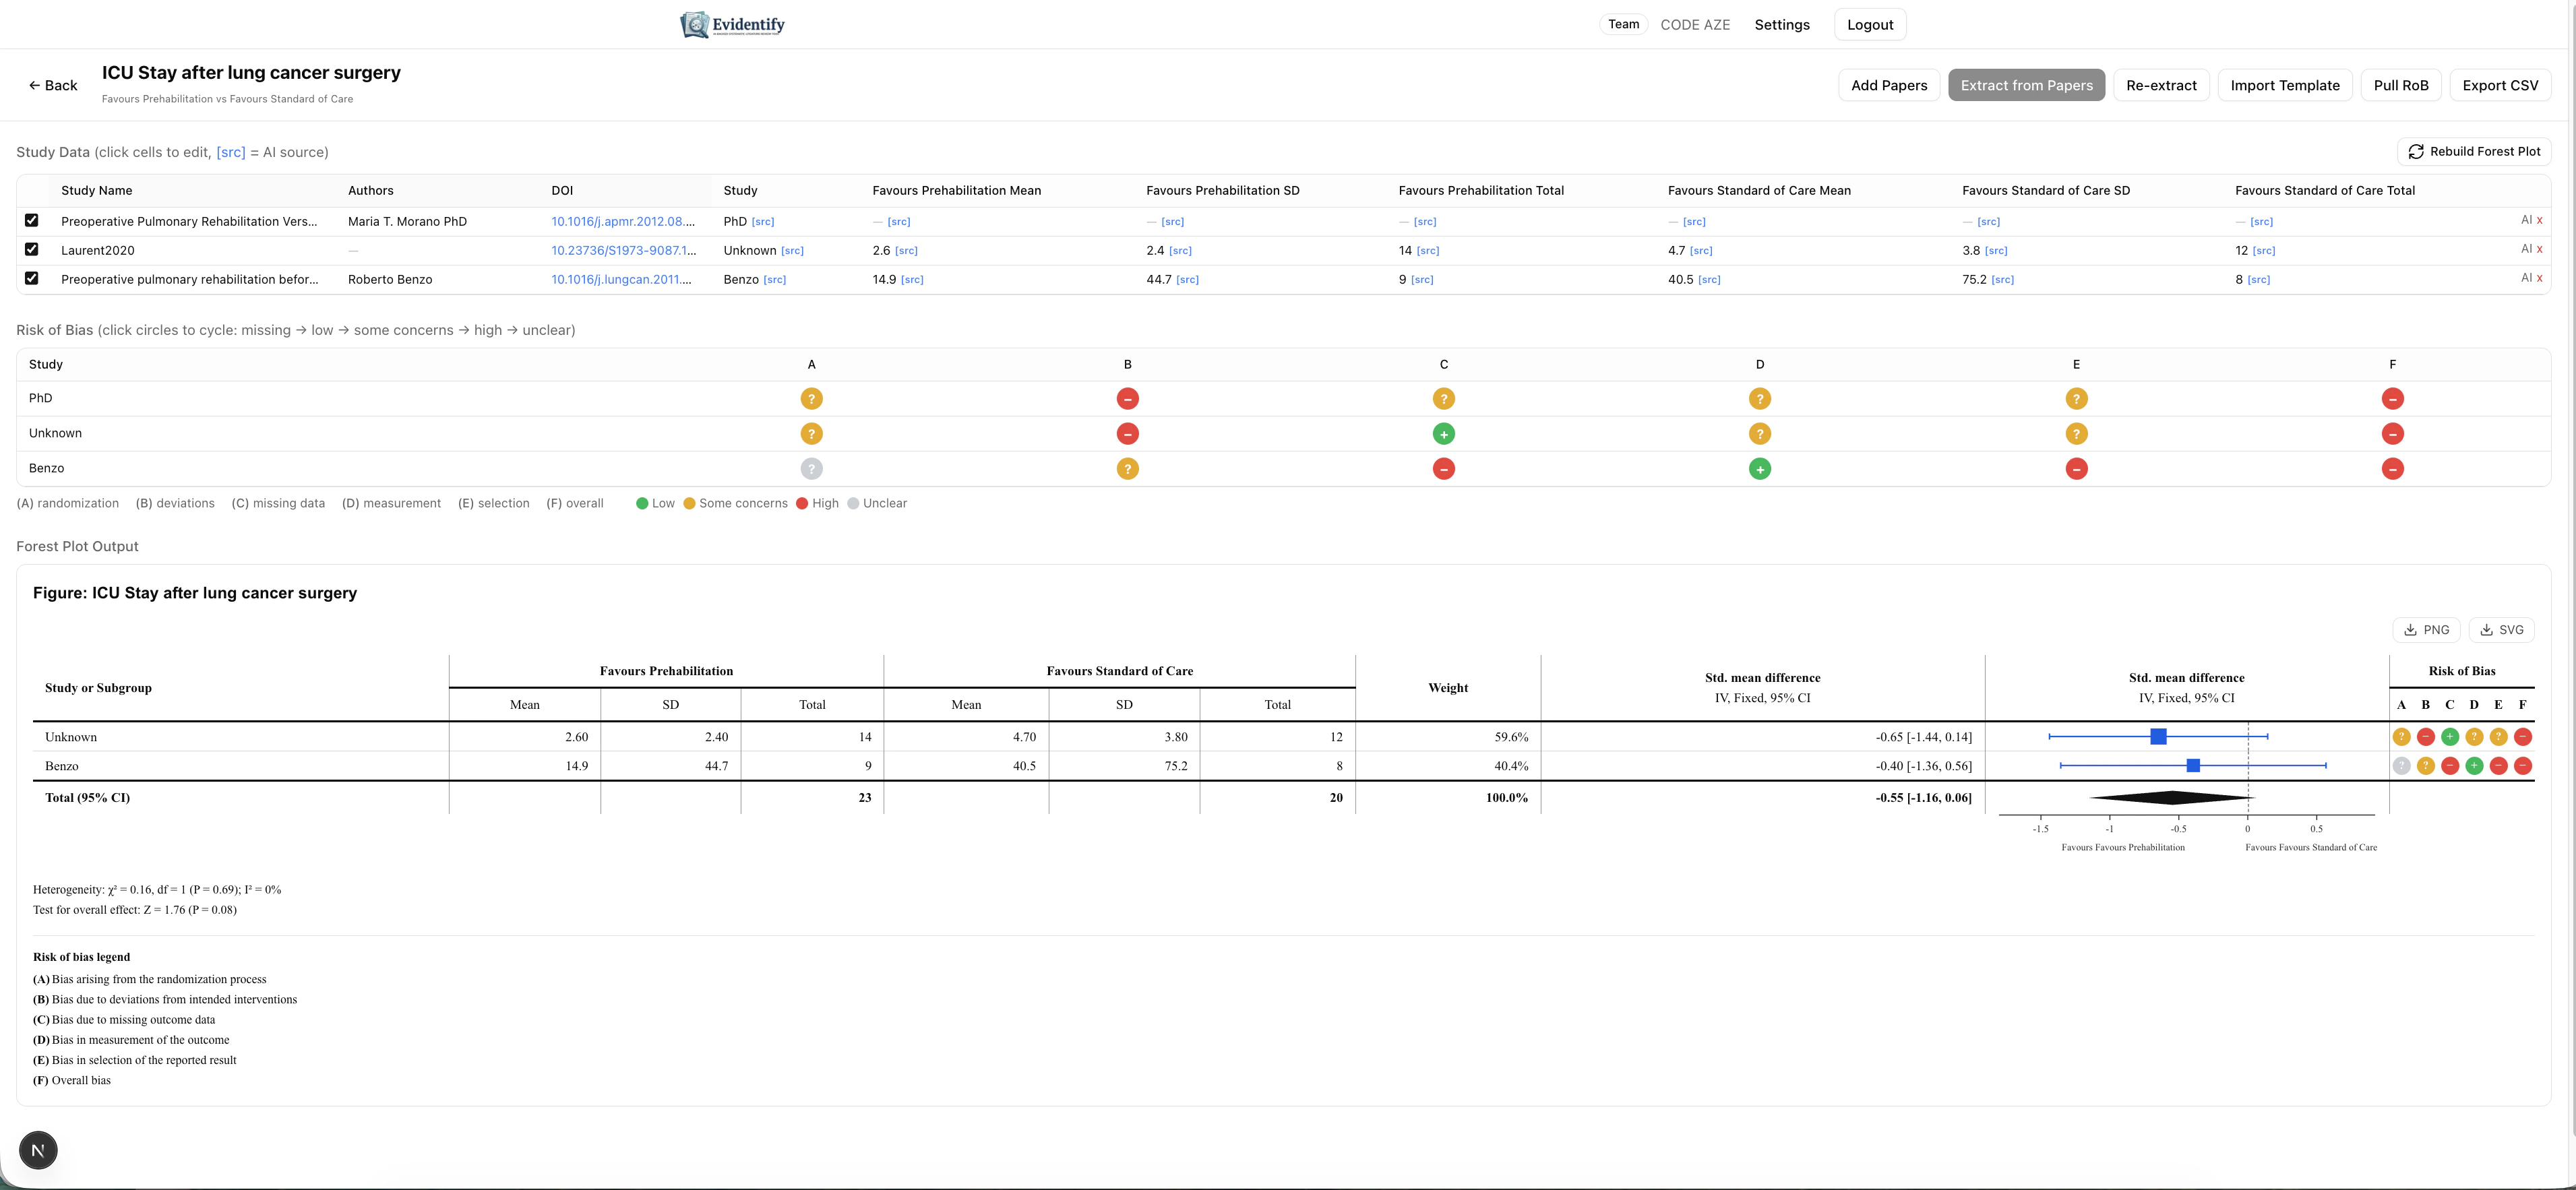 The forest plot shows:
* **Effect sizes** with confidence intervals for each study
* **Diamond** for the pooled effect
* **Heterogeneity statistics** (I², Q, p-value)
* **Risk of bias traffic lights** — colored circles showing RoB2 domain ratings per study
* **Overall risk of bias** column
### Export Options
| Format | Description |
| ------------------- | ---------------------------------------------- |
| **Pull RoB** | Sync risk of bias data from quality assessment |
| **Import Template** | Import study data from spreadsheet |
| **Export CSV** | Download the full analysis table |
## What's Next?
After meta-analysis, proceed to [Manuscript Writer](/user-guide/manuscript-writer) to draft your Results and Discussion sections.
The forest plot shows:
* **Effect sizes** with confidence intervals for each study
* **Diamond** for the pooled effect
* **Heterogeneity statistics** (I², Q, p-value)
* **Risk of bias traffic lights** — colored circles showing RoB2 domain ratings per study
* **Overall risk of bias** column
### Export Options
| Format | Description |
| ------------------- | ---------------------------------------------- |
| **Pull RoB** | Sync risk of bias data from quality assessment |
| **Import Template** | Import study data from spreadsheet |
| **Export CSV** | Download the full analysis table |
## What's Next?
After meta-analysis, proceed to [Manuscript Writer](/user-guide/manuscript-writer) to draft your Results and Discussion sections.